TOWARD AN INFORMED VOTE
D. Wayne Berman
October 28, 2010
dwberman@likecassandra.com
I have been frustrated with the quality of the campaigns being run by candidates for national office and polls reported on the news suggest that I am not alone. It seems that the candidates have decided we Americans want to base our voting decisions on gossip, innuendo, and outright lies, rather than fact. Unfortunately, I have also found reporting by much of the news media to be similarly limited, which hampers informed decision-making.
This year, I have decided to do something about it. Through research, I developed a perspective on the effects that various administrations have had on the health of the nation's economy. To their credit, the Obama administration has facilitated such research by making budgetary details and economic statistics readily available online. Thus, it's not surprising that much of what I have found has been reported by others. To my knowledge, however, no one has put things together into an integrated whole. My findings, which are summarized in the attached figure and table, tell a very different story than we hear from many candidates.
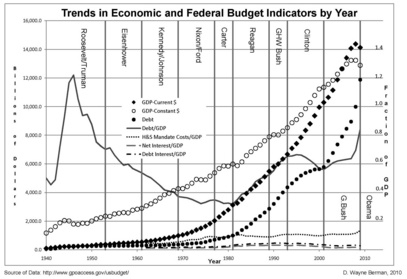
The Figure traces a variety of economic statistics from 1940 to 2009, including: the GrossDomestic-Product (GDP in both current and constant dollars) and the national debt. The figure also tracks a number of ratios including ratios of: the national debt/GDP, costs of health and human service (H&S) mandates/GDP, total interest on the debt/GDP, and net interest on the debt/GDP. Health and human service mandates including Social Security (SS), Medicare, Medicaid, health insurance for government employees and veterans, and a few other small programs. The reason that the net interest paid on the debt is less than the total interest that is owed is that it is partially offset by interest earned on the trust funds that are held to pay for SS and Medicare. Total mandated obligations of the government are approximately equal to the sum of the H&S Mandate costs and net interest on the debt. The debt/GDP ratio (as well as the ratios of the other costs to GDP) is the size of the debt relative to the size of the economy and thus a measure of our ability to pay the debt (and the other costs). Thus, for many purposes, this is a better measure of the impact of such costs than their absolute value. Note that ratio values are linked to the vertical axis on the right of the figure.
As can be seen in the figure, both the GDP and the national debt have tended to rise over time. However, after initially climbing to a peak in World War II (due to the cost of the war), the debt/GDP ratio tended to decline from this peak until the Reagan administration. In fact, the rise in the debt/GDP ratio (which more than doubled) under the Reagan and GHW Bush administrations, was the first major peacetime rise in this ratio since the founding of our nation. It is also worth noting that, under Reagan, the U.S. went from the biggest creditor to the biggest debtor nation (data not shown). Thus, by depleting the financial resources of the country, Reagan crippled the ability of future administrations to respond to financial crises.
Importantly, the effects of government mandates had virtually nothing to do with the increase in the debt under Reagan. As can be seen in the figure, the cost of these mandates per GDP remained relatively stable between 1975 and 2000 and administrations both before and after Reagan over this period were able to shrink the debt/GDP ratio. From 2009 forward, however, the cost of H&S mandates/GDP is projected to rise modestly over time while the cost of interest on the national debt/GDP is projected to skyrocket (once interest rates climb back to normal levels after the effects of the current recession end). Contrary to popular belief, the nonpartisan Congressional Budget Office (CBO) projects that the cost of the recently passed health care legislation will reduce the future costs of H&S mandates relative to what they would be without the changes. Thus, it is expected to help, not hurt. Nevertheless, as mandate and interest costs are a substantial and soon to be growing fraction of the total Federal Budget (which is about 30% of GDP), these costs need to be further controlled.
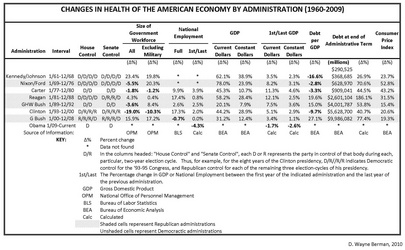
The table traces the history of change in the sizes of the government workforce, the national workforce, the Gross-Domestic-Product (GDP), and the national debt over the course of the last nine administrations (although, to smooth the effects of non-election power transfers among the first four administrations, I have combined those of Kennedy/Johnson and Nixon/Ford). I also note whether Democrats (D) or Republicans (R) were in control of the House and Senate for each of the two-year election cycles under each administration. I also believe that, approximately until the end of the Ford administration, our economy was still being driven primarily by unspent, personal wealth accumulated during World War II. Therefore, most of the following discussion focuses on Carter forward.
Much of what the attached table shows runs counter to popular belief. First, with regard to the size of government, (excluding military personnel, Col 6), government payrolls actually shrank under the two Democratic administrations (Carter and Clinton) but grew under Republicans. In fact, George Bush presided over the largest increase in the size of government since Nixon/Ford.
With regard to national employment (Col 7), one can see that the nation's workforce grew under all administrations, except that of George Bush. Interestingly, the work force grew the most and by approximately the same percentage under Reagan and Clinton. A similar trend is seen in GDP (best evaluated in constant dollars, Col.10). Here again, Reagan and Clinton appeared equally successful at growing the economy. However, under Reagan, as previously described, all growth came at the expense of the largest increase in the national debt since World War II (Cols. 13,14, and 15). In contrast, the debt as a fraction of GDP (Col 13) actually shrank under Clinton and the difference in debt growth is due almost entirely to the differences in tax policies pursued by the Reagan and Clinton administrations (reductions and increases, respectively).
Similar to what happened under Reagan, due to tax policy, both the debt and debt/GDP ratio exploded under G. Bush, but this time without the benefit of substantial growth in the national workforce or the GDP. Thus, given the different outcomes under these administrations, there is no simple or direct relationship between economic growth and tax policy.
To better understand the state of the economy inherited by each new administration, the percentage change (in both National employment and GDP) between the first year of the new and the last year of the previous administration are also presented in the table. For example, the trends in employment and GDP inherited by Obama (from the Bush administration) shrank by 4.3% and 2.6% (Cols 8 and 12) respectively and, as can be seen from the table, Obama's is the only administration in recent times, whose term began with both employment and GDP severely contracting; none of the other recent recessions (which have all been smaller than the current one) occurred at the immediate start of a new administration. Moreover, the Obama administration inherited a debt/GDP ratio not seen since World War II (due almost entirely to tax policies under the Reagan and G. Bush administrations).
Finally, the last column in the table provides an indication of inflation. As can be seen, since inflation peaked under Nixon (remember price controls), it has tended to declined under more recent administrations.
In summary and contrary to popular belief, since at least 1975, Republicans have been no better than Democrats at growing either the national workforce or the general economy, have grown the government substantially more than Democrats, have contributed substantially more to the national debt, and it is only under Republicans that the debt/GDP ratio has increased.
Reasonably (with two notable exceptions), the behavior of the economy during the tenure of each administration (potentially stretching into the first year or so of the next) can be linked to the tax, spending, and regulatory policies of that administration. The two exceptions are the long-term effects of the debt/GDP ratio and government mandate costs left as legacies by various administrations; these have effects far into the future.
Although I am disappointed with the irresponsible behavior and statements of many of the individuals currently running for office, as are many, I am hoping that we can each see enough of the big picture to elect those who will help solve our problems instead of adding to them. As shown above, we need individuals who recognize the need for growth while managing debt; who understand the need for new ways to fund/finance/control mandate costs; and who understand that undirected tax cuts do not necessarily stimulate growth.